D. A. Green
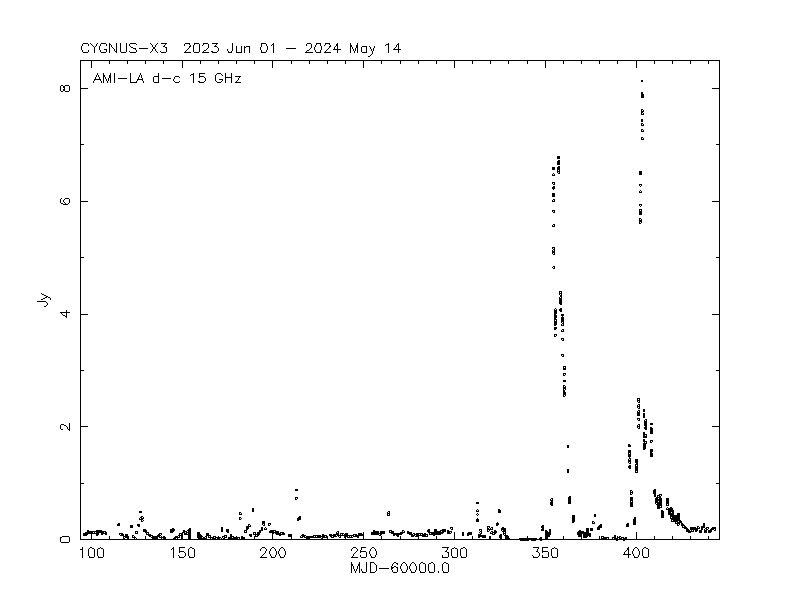
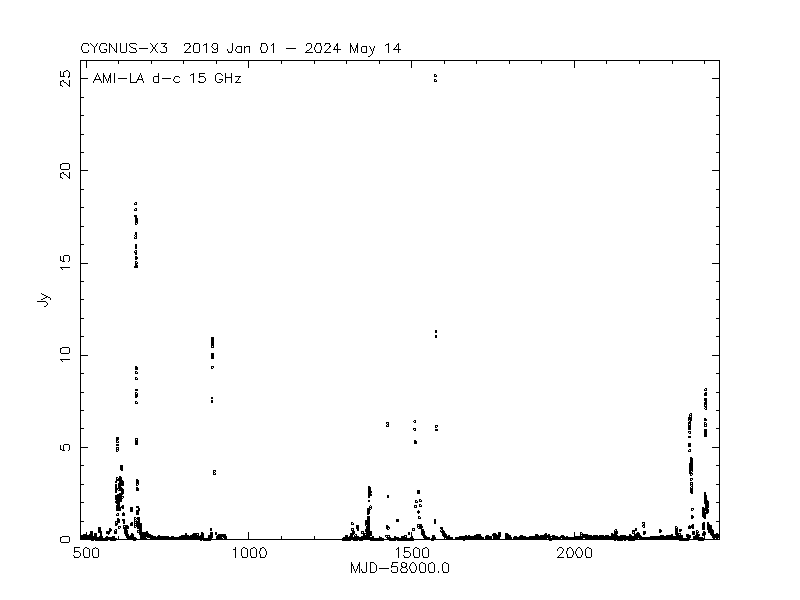
The figures below give the radio flux density of Cygnus X-3 at 15 GHz, as monitored by the AMI Large Array. (Note: the dates on the plots are ± 1 day from the range of observations included.)
Typically an observation consists of several (two to five) 10 min scans on Cygnus X-3 (with short calibration observations interleaved), and the plots show the average flux density per 10 min scan. (But where the scheduling allowed it, some longer observations were made, or two short observations were scheduled on the same day.)
Note: only limited coverage of the outburst in 2020 Feb was possible with the AMI Large Array, due to high winds (storms Ciara and Dennis). However, several observations were instead made with the AMI Small Array, see 2020RNAAS...4...36G (although the results are not included in the plots below).
Due to the Coronavirus pandemic, observations were stopped on 2020 March 20th and restarted on 2021 March 16th.

Recent observations of Cygnus X-3, from the 2023 June (Click on plot to toggle between linear and logarithmic plots.)

Observations of Cygnus X-3, from the start of 2019. (Click on plot to toggle between linear and logarithmic plots.)
(Note: reload the page, if needed, to update the figures.)
Note: these results are from preliminary quick look analyses using automated scripts (which occaisionally give wrongly scaled results), and should not themselves be used for any scientific studies.
Dave Green -- (last changed 2024-April-22)