Wide-field imaging demonstration
This script makes a fake data set, fills it with a number of point components, and then images it using a variety of algorithms. See imaging-fits for a similar notebook that checks for errors in the recovered properties of the images.
The measurement equation for a wide field of view interferometer is:
We will show various algorithms for computing approximations to this integral. Calculation of the visibility V from the sky brightness I is called predict, and the inverese is called invert.
%matplotlib inline

import os
import sys

sys.path.append(os.path.join('..', '..'))

from data_models.parameters import arl_path

results_dir = arl_path('test_results')

from matplotlib import pylab

import numpy

from astropy.coordinates import SkyCoord
from astropy import units as u
from astropy.wcs.utils import pixel_to_skycoord

from matplotlib import pyplot as plt
from mpl_toolkits.mplot3d import Axes3D

from data_models.polarisation import PolarisationFrame

from processing_components.image import  image_raster_iter
from processing_library.image import create_w_term_like

# Use serial wrappers by default
from processing_components.visibility import create_visibility, create_visibility, create_visibility_from_rows
from processing_components.skycomponent import create_skycomponent
from processing_components.image import show_image, export_image_to_fits
from processing_components.visibility import  vis_timeslice_iter
from processing_components.simulation.configurations import create_named_configuration
from processing_components.imaging import invert_2d, create_image_from_visibility, \
    predict_skycomponent_visibility, advise_wide_field
from processing_components.visibility import  vis_timeslice_iter
from processing_components.imaging import  weight_visibility
from processing_components.visibility import  vis_timeslices

from processing_components.griddata import create_awterm_convolutionfunction
from processing_components.griddata.convolution_functions import apply_bounding_box_convolutionfunction

# Use arlexecute for imaging
from wrappers.arlexecute.execution_support.arlexecute import arlexecute
from workflows.arlexecute.imaging.imaging_arlexecute import invert_list_arlexecute_workflow

import logging

log = logging.getLogger()
log.setLevel(logging.DEBUG)
log.addHandler(logging.StreamHandler(sys.stdout))

doplot = True
Loaded backend module://ipykernel.pylab.backend_inline version unknown.
pylab.rcParams['figure.figsize'] = (12.0, 12.0)
pylab.rcParams['image.cmap'] = 'rainbow'
Construct the SKA1-LOW core configuration
lowcore = create_named_configuration('LOWBD2-CORE')
create_named_configuration: LOWBD2-CORE
    (<Quantity -2565018.31203579 m>, <Quantity 5085711.90373391 m>, <Quantity -2861033.10788063 m>)
    GeodeticLocation(lon=<Longitude 116.76444824 deg>, lat=<Latitude -26.82472208 deg>, height=<Quantity 300. m>)
create_configuration_from_file: 166 antennas/stations
We create the visibility.
This just makes the uvw, time, antenna1, antenna2, weight columns in a table
times = numpy.array([-3.0, -2.0, -1.0, 0.0, 1.0, 2.0, 3.0]) * (numpy.pi / 12.0)
frequency = numpy.array([1e8])
channel_bandwidth = numpy.array([1e7])


reffrequency = numpy.max(frequency)
phasecentre = SkyCoord(ra=+15.0 * u.deg, dec=-45.0 * u.deg, frame='icrs', equinox='J2000')
vt = create_visibility(lowcore, times, frequency, channel_bandwidth=channel_bandwidth,
                       weight=1.0, phasecentre=phasecentre, polarisation_frame=PolarisationFrame("stokesI"))
create_visibility: 95865 rows, 0.010 GB
create_visibility: flagged 0/95865 visibilities below elevation limit 0.261799 (rad)
Advise on wide field parameters. This returns a dictionary with all the input and calculated variables.
advice = advise_wide_field(vt, wprojection_planes=1)
advise_wide_field: Maximum wavelength 2.998 (meters)
advise_wide_field: Minimum wavelength 2.998 (meters)
advise_wide_field: Maximum baseline 262.6 (wavelengths)
advise_wide_field: Maximum w 169.4 (wavelengths)
advise_wide_field: Station/dish diameter 35.0 (meters)
advise_wide_field: Primary beam 0.0857 (rad) 4.91 (deg) 1.77e+04 (asec)
advise_wide_field: Image field of view 0.514 (rad) 29.4 (deg) 1.06e+05 (asec)
advise_wide_field: Synthesized beam 0.00381 (rad) 0.218 (deg) 785 (asec)
advise_wide_field: Cellsize 0.00127 (rad) 0.0727 (deg) 262 (asec)
advice_wide_field: Npixels per side = 405
advice_wide_field: Npixels (power of 2) per side = 512
advice_wide_field: Npixels (power of 2, 3) per side = 512
advice_wide_field: Npixels (power of 2, 3, 4, 5) per side = 405
advice_wide_field: W sampling for full image = 0.2 (wavelengths)
advice_wide_field: W sampling for primary beam = 8.7 (wavelengths)
advice_wide_field: Time sampling for full image = 25.2 (s)
advice_wide_field: Time sampling for primary beam = 908.6 (s)
advice_wide_field: Frequency sampling for full image = 29212.6 (Hz)
advice_wide_field: Frequency sampling for primary beam = 1051653.8 (Hz)
advice_wide_field: Number of planes in w stack 39 (primary beam)
advice_wide_field: Number of planes in w projection 39 (primary beam)
advice_wide_field: W support = 6 (pixels) (primary beam)
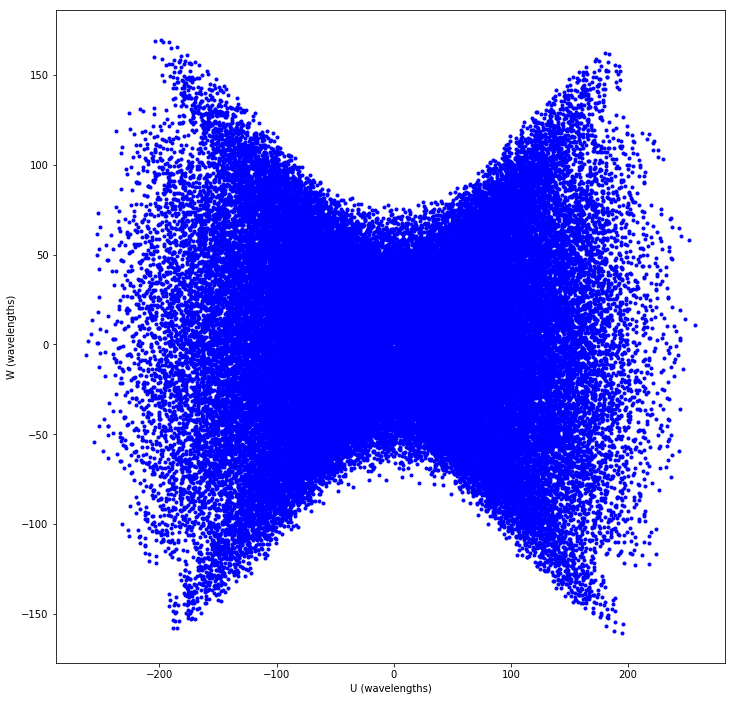
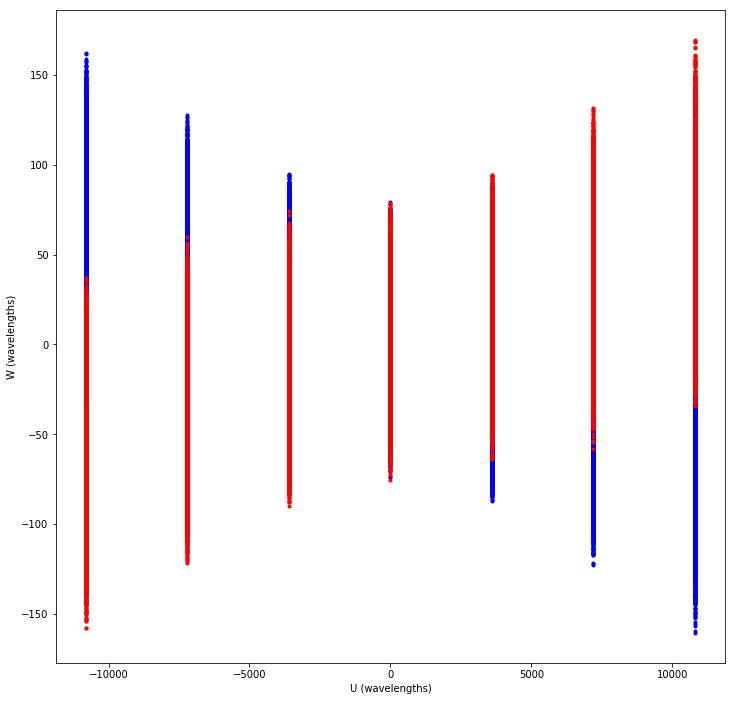
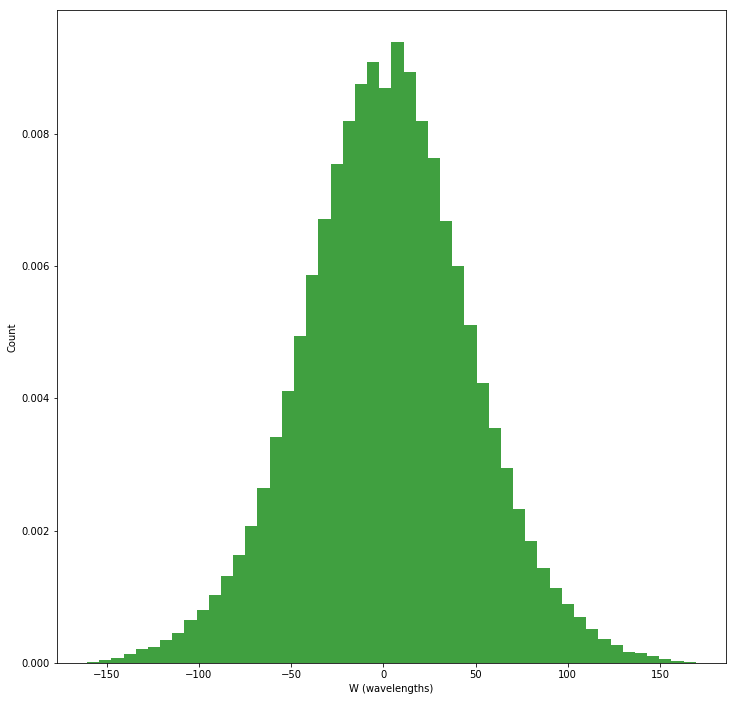
Plot the synthesized UV coverage.
if doplot:
    plt.clf()
    plt.plot(vt.data['uvw'][:, 0], vt.data['uvw'][:, 1], '.', color='b')
    plt.plot(-vt.data['uvw'][:, 0], -vt.data['uvw'][:, 1], '.', color='r')
    plt.xlabel('U (wavelengths)')
    plt.ylabel('V (wavelengths)')
    plt.show()

    plt.clf()
    plt.plot(vt.data['uvw'][:, 0], vt.data['uvw'][:, 2], '.', color='b')
    plt.xlabel('U (wavelengths)')
    plt.ylabel('W (wavelengths)')
    plt.show()

    plt.clf()
    plt.plot(vt.data['time'][vt.u>0.0], vt.data['uvw'][:, 2][vt.u>0.0], '.', color='b')
    plt.plot(vt.data['time'][vt.u<=0.0], vt.data['uvw'][:, 2][vt.u<=0.0], '.', color='r')
    plt.xlabel('U (wavelengths)')
    plt.ylabel('W (wavelengths)')
    plt.show()

    plt.clf()
    n, bins, patches = plt.hist(vt.w, 50, normed=1, facecolor='green', alpha=0.75)
    plt.xlabel('W (wavelengths)')
    plt.ylabel('Count')
    plt.show()
update_title_pos
findfont: Matching :family=sans-serif:style=normal:variant=normal:weight=normal:stretch=normal:size=10.0 to DejaVu Sans ('/home/jenkins-slave/workspace/ce-library_feature-improved-docs/_build/lib/python3.5/site-packages/matplotlib/mpl-data/fonts/ttf/DejaVuSans.ttf') with score of 0.050000.
update_title_pos
update_title_pos
update_title_pos

update_title_pos
update_title_pos
update_title_pos
update_title_pos
update_title_pos
update_title_pos
update_title_pos
update_title_pos
update_title_pos
/home/jenkins-slave/workspace/ce-library_feature-improved-docs/_build/lib/python3.5/site-packages/matplotlib/axes/_axes.py:6521: MatplotlibDeprecationWarning:
The 'normed' kwarg was deprecated in Matplotlib 2.1 and will be removed in 3.1. Use 'density' instead.
  alternative="'density'", removal="3.1")
update_title_pos
update_title_pos
update_title_pos
Show the planar nature of the uvw sampling, rotating with hour angle
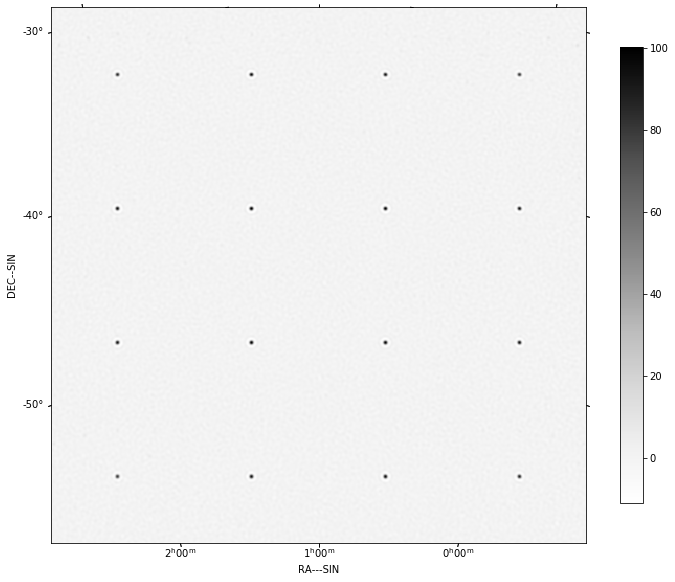
Create a grid of components and predict each in turn, using the full phase term including w.
npixel = 512
cellsize=0.001
facets = 4
flux = numpy.array([[100.0]])
vt.data['vis'] *= 0.0

model = create_image_from_visibility(vt, npixel=512, cellsize=0.001, npol=1)
spacing_pixels = npixel // facets
log.info('Spacing in pixels = %s' % spacing_pixels)
spacing = 180.0 * cellsize * spacing_pixels / numpy.pi
centers = -1.5, -0.5, +0.5, +1.5
comps=list()
for iy in centers:
    for ix in centers:
        pra =  int(round(npixel // 2 + ix * spacing_pixels - 1))
        pdec = int(round(npixel // 2 + iy * spacing_pixels - 1))
        sc = pixel_to_skycoord(pra, pdec, model.wcs)
        log.info("Component at (%f, %f) %s" % (pra, pdec, str(sc)))
        comp = create_skycomponent(flux=flux, frequency=frequency, direction=sc,
                                   polarisation_frame=PolarisationFrame("stokesI"))
        comps.append(comp)
predict_skycomponent_visibility(vt, comps)
create_image_from_visibility: Parsing parameters to get definition of WCS
create_image_from_visibility: Defining single channel Image at <SkyCoord (ICRS): (ra, dec) in deg
    (15., -45.)>, starting frequency 100000000.0 Hz, and bandwidth 9999999.9999 Hz
create_image_from_visibility: uvmax = 262.634709 wavelengths
create_image_from_visibility: Critical cellsize = 0.001904 radians, 0.109079 degrees
create_image_from_visibility: Cellsize          = 0.001 radians, 0.0572958 degrees
create_image_from_visibility: image shape is [1, 1, 512, 512]
Spacing in pixels = 128
Component at (63.000000, 63.000000) <SkyCoord (ICRS): (ra, dec) in deg
    (34.54072794, -54.75874632)>
Component at (191.000000, 63.000000) <SkyCoord (ICRS): (ra, dec) in deg
    (21.67016023, -55.97155392)>
Component at (319.000000, 63.000000) <SkyCoord (ICRS): (ra, dec) in deg
    (8.53437599, -55.98101975)>
Component at (447.000000, 63.000000) <SkyCoord (ICRS): (ra, dec) in deg
    (355.65593443, -54.78677607)>
Component at (63.000000, 191.000000) <SkyCoord (ICRS): (ra, dec) in deg
    (31.62619218, -47.58256993)>
Component at (191.000000, 191.000000) <SkyCoord (ICRS): (ra, dec) in deg
    (20.64032824, -48.59686272)>
Component at (319.000000, 191.000000) <SkyCoord (ICRS): (ra, dec) in deg
    (9.53290242, -48.6047374)>
Component at (447.000000, 191.000000) <SkyCoord (ICRS): (ra, dec) in deg
    (358.54340538, -47.60612847)>
Component at (63.000000, 319.000000) <SkyCoord (ICRS): (ra, dec) in deg
    (29.67602513, -40.37841403)>
Component at (191.000000, 319.000000) <SkyCoord (ICRS): (ra, dec) in deg
    (19.96147534, -41.27364866)>
Component at (319.000000, 319.000000) <SkyCoord (ICRS): (ra, dec) in deg
    (10.19103897, -41.28057703)>
Component at (447.000000, 319.000000) <SkyCoord (ICRS): (ra, dec) in deg
    (0.4748226, -40.3992699)>
Component at (63.000000, 447.000000) <SkyCoord (ICRS): (ra, dec) in deg
    (28.31336506, -33.05766481)>
Component at (191.000000, 447.000000) <SkyCoord (ICRS): (ra, dec) in deg
    (19.49068833, -33.88364257)>
Component at (319.000000, 447.000000) <SkyCoord (ICRS): (ra, dec) in deg
    (10.64743131, -33.89002022)>
Component at (447.000000, 447.000000) <SkyCoord (ICRS): (ra, dec) in deg
    (1.82415538, -33.07694985)>
<data_models.memory_data_models.Visibility at 0x7f2b719cfe10>
Make the dirty image and point spread function using the two-dimensional approximation:
Note that the shape of the sources vary with position in the image. This space-variant property of the PSF arises from the w-term neglected in the two-dimensional invert.
arlexecute.set_client(use_dask=True)
Using selector: EpollSelector
Using selector: EpollSelector
dirty = create_image_from_visibility(vt, npixel=512, cellsize=0.001,
                                     polarisation_frame=PolarisationFrame("stokesI"))
vt = weight_visibility(vt, dirty)

future = invert_list_arlexecute_workflow([vt], [dirty], context='2d')
dirty, sumwt = arlexecute.compute(future, sync=True)[0]

if doplot:
    show_image(dirty)

print("Max, min in dirty image = %.6f, %.6f, sumwt = %f" % (dirty.data.max(), dirty.data.min(), sumwt))

export_image_to_fits(dirty, '%s/imaging-wterm_dirty.fits' % (results_dir))
create_image_from_visibility: Parsing parameters to get definition of WCS
create_image_from_visibility: Defining single channel Image at <SkyCoord (ICRS): (ra, dec) in deg
    (15., -45.)>, starting frequency 100000000.0 Hz, and bandwidth 9999999.9999 Hz
create_image_from_visibility: uvmax = 262.634709 wavelengths
create_image_from_visibility: Critical cellsize = 0.001904 radians, 0.109079 degrees
create_image_from_visibility: Cellsize          = 0.001 radians, 0.0572958 degrees
create_image_from_visibility: image shape is [1, 1, 512, 512]
/home/jenkins-slave/workspace/ce-library_feature-improved-docs/_build/lib/python3.5/site-packages/distributed/worker.py:3235: UserWarning: Large object of size 2.10 MB detected in task graph:
  ('getitem-0f26109ea1d3a935e74f14f4a5bf1dd8', <data ... -c71747eeb0c1')
Consider scattering large objects ahead of time
with client.scatter to reduce scheduler burden and
keep data on workers

    future = client.submit(func, big_data)    # bad

    big_future = client.scatter(big_data)     # good
    future = client.submit(func, big_future)  # good
  % (format_bytes(len(b)), s)
locator: <matplotlib.colorbar._ColorbarAutoLocator object at 0x7f2b903a1198>
Using auto colorbar locator on colorbar
locator: <matplotlib.colorbar._ColorbarAutoLocator object at 0x7f2b903a1198>
Setting pcolormesh
Max, min in dirty image = 49.220748, -8.719588, sumwt = 31701.000000
update_title_pos
findfont: Matching :family=STIXGeneral:style=normal:variant=normal:weight=normal:stretch=normal:size=10.0 to STIXGeneral ('/home/jenkins-slave/workspace/ce-library_feature-improved-docs/_build/lib/python3.5/site-packages/matplotlib/mpl-data/fonts/ttf/STIXGeneral.ttf') with score of 0.050000.
findfont: Matching :family=STIXSizeOneSym:style=normal:variant=normal:weight=normal:stretch=normal:size=10.0 to STIXSizeOneSym ('/home/jenkins-slave/workspace/ce-library_feature-improved-docs/_build/lib/python3.5/site-packages/matplotlib/mpl-data/fonts/ttf/STIXSizOneSymReg.ttf') with score of 0.050000.
findfont: Matching :family=STIXSizeTwoSym:style=normal:variant=normal:weight=normal:stretch=normal:size=10.0 to STIXSizeTwoSym ('/home/jenkins-slave/workspace/ce-library_feature-improved-docs/_build/lib/python3.5/site-packages/matplotlib/mpl-data/fonts/ttf/STIXSizTwoSymReg.ttf') with score of 0.050000.
findfont: Matching :family=STIXSizeThreeSym:style=normal:variant=normal:weight=normal:stretch=normal:size=10.0 to STIXSizeThreeSym ('/home/jenkins-slave/workspace/ce-library_feature-improved-docs/_build/lib/python3.5/site-packages/matplotlib/mpl-data/fonts/ttf/STIXSizThreeSymReg.ttf') with score of 0.050000.
findfont: Matching :family=STIXSizeFourSym:style=normal:variant=normal:weight=normal:stretch=normal:size=10.0 to STIXSizeFourSym ('/home/jenkins-slave/workspace/ce-library_feature-improved-docs/_build/lib/python3.5/site-packages/matplotlib/mpl-data/fonts/ttf/STIXSizFourSymReg.ttf') with score of 0.050000.
findfont: Matching :family=STIXSizeFiveSym:style=normal:variant=normal:weight=normal:stretch=normal:size=10.0 to STIXSizeFiveSym ('/home/jenkins-slave/workspace/ce-library_feature-improved-docs/_build/lib/python3.5/site-packages/matplotlib/mpl-data/fonts/ttf/STIXSizFiveSymReg.ttf') with score of 0.050000.
findfont: Matching :family=STIXNonUnicode:style=normal:variant=normal:weight=normal:stretch=normal:size=10.0 to STIXNonUnicode ('/home/jenkins-slave/workspace/ce-library_feature-improved-docs/_build/lib/python3.5/site-packages/matplotlib/mpl-data/fonts/ttf/STIXNonUni.ttf') with score of 0.050000.
findfont: Matching :family=STIXNonUnicode:style=normal:variant=normal:weight=bold:stretch=normal:size=10.0 to STIXNonUnicode ('/home/jenkins-slave/workspace/ce-library_feature-improved-docs/_build/lib/python3.5/site-packages/matplotlib/mpl-data/fonts/ttf/STIXNonUniBol.ttf') with score of 0.000000.
findfont: Matching :family=STIXNonUnicode:style=italic:variant=normal:weight=normal:stretch=normal:size=10.0 to STIXNonUnicode ('/home/jenkins-slave/workspace/ce-library_feature-improved-docs/_build/lib/python3.5/site-packages/matplotlib/mpl-data/fonts/ttf/STIXNonUniIta.ttf') with score of 0.050000.
findfont: Matching :family=STIXGeneral:style=italic:variant=normal:weight=normal:stretch=normal:size=10.0 to STIXGeneral ('/home/jenkins-slave/workspace/ce-library_feature-improved-docs/_build/lib/python3.5/site-packages/matplotlib/mpl-data/fonts/ttf/STIXGeneralItalic.ttf') with score of 0.050000.
findfont: Matching :family=STIXGeneral:style=normal:variant=normal:weight=bold:stretch=normal:size=10.0 to STIXGeneral ('/home/jenkins-slave/workspace/ce-library_feature-improved-docs/_build/lib/python3.5/site-packages/matplotlib/mpl-data/fonts/ttf/STIXGeneralBol.ttf') with score of 0.000000.
findfont: Matching :family=cmtt10:style=normal:variant=normal:weight=normal:stretch=normal:size=10.0 to cmtt10 ('/home/jenkins-slave/workspace/ce-library_feature-improved-docs/_build/lib/python3.5/site-packages/matplotlib/mpl-data/fonts/ttf/cmtt10.ttf') with score of 0.050000.
findfont: Matching :family=cmss10:style=normal:variant=normal:weight=normal:stretch=normal:size=10.0 to cmss10 ('/home/jenkins-slave/workspace/ce-library_feature-improved-docs/_build/lib/python3.5/site-packages/matplotlib/mpl-data/fonts/ttf/cmss10.ttf') with score of 0.050000.
findfont: Matching :family=cmmi10:style=normal:variant=normal:weight=normal:stretch=normal:size=10.0 to cmmi10 ('/home/jenkins-slave/workspace/ce-library_feature-improved-docs/_build/lib/python3.5/site-packages/matplotlib/mpl-data/fonts/ttf/cmmi10.ttf') with score of 0.050000.
findfont: Matching :family=cmsy10:style=normal:variant=normal:weight=normal:stretch=normal:size=10.0 to cmsy10 ('/home/jenkins-slave/workspace/ce-library_feature-improved-docs/_build/lib/python3.5/site-packages/matplotlib/mpl-data/fonts/ttf/cmsy10.ttf') with score of 0.050000.
findfont: Matching :family=cmex10:style=normal:variant=normal:weight=normal:stretch=normal:size=10.0 to cmex10 ('/home/jenkins-slave/workspace/ce-library_feature-improved-docs/_build/lib/python3.5/site-packages/matplotlib/mpl-data/fonts/ttf/cmex10.ttf') with score of 0.050000.
findfont: Matching :family=cmb10:style=normal:variant=normal:weight=normal:stretch=normal:size=10.0 to cmb10 ('/home/jenkins-slave/workspace/ce-library_feature-improved-docs/_build/lib/python3.5/site-packages/matplotlib/mpl-data/fonts/ttf/cmb10.ttf') with score of 0.050000.
findfont: Matching :family=cmr10:style=normal:variant=normal:weight=normal:stretch=normal:size=10.0 to cmr10 ('/home/jenkins-slave/workspace/ce-library_feature-improved-docs/_build/lib/python3.5/site-packages/matplotlib/mpl-data/fonts/ttf/cmr10.ttf') with score of 0.050000.
findfont: Matching :family=DejaVu Sans:style=normal:variant=normal:weight=normal:stretch=normal:size=10.0 to DejaVu Sans ('/home/jenkins-slave/workspace/ce-library_feature-improved-docs/_build/lib/python3.5/site-packages/matplotlib/mpl-data/fonts/ttf/DejaVuSans.ttf') with score of 0.050000.
findfont: Matching :family=DejaVu Sans Display:style=normal:variant=normal:weight=normal:stretch=normal:size=10.0 to DejaVu Sans Display ('/home/jenkins-slave/workspace/ce-library_feature-improved-docs/_build/lib/python3.5/site-packages/matplotlib/mpl-data/fonts/ttf/DejaVuSansDisplay.ttf') with score of 0.050000.
findfont: Matching :family=DejaVu Sans Mono:style=normal:variant=normal:weight=normal:stretch=normal:size=10.0 to DejaVu Sans Mono ('/home/jenkins-slave/workspace/ce-library_feature-improved-docs/_build/lib/python3.5/site-packages/matplotlib/mpl-data/fonts/ttf/DejaVuSansMono.ttf') with score of 0.050000.
findfont: Matching :family=DejaVu Sans:style=italic:variant=normal:weight=normal:stretch=normal:size=10.0 to DejaVu Sans ('/home/jenkins-slave/workspace/ce-library_feature-improved-docs/_build/lib/python3.5/site-packages/matplotlib/mpl-data/fonts/ttf/DejaVuSans-Oblique.ttf') with score of 0.150000.
findfont: Matching :family=DejaVu Sans:style=normal:variant=normal:weight=bold:stretch=normal:size=10.0 to DejaVu Sans ('/home/jenkins-slave/workspace/ce-library_feature-improved-docs/_build/lib/python3.5/site-packages/matplotlib/mpl-data/fonts/ttf/DejaVuSans-Bold.ttf') with score of 0.000000.
update_title_pos
update_title_pos
update_title_pos
update_title_pos
update_title_pos
update_title_pos
update_title_pos
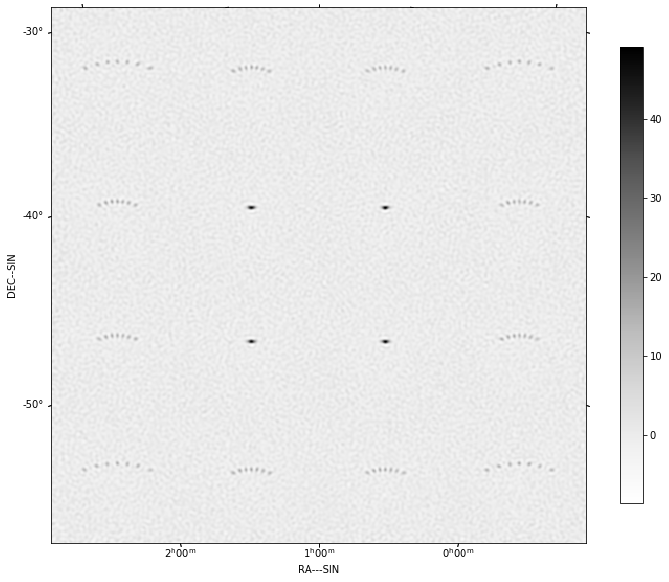
This occurs because the Fourier transform relationship between sky brightness and visibility is only accurate over small fields of view.
Hence we can make an accurate image by partitioning the image plane into small regions, treating each separately and then glueing the resulting partitions into one image. We call this image plane partitioning image plane faceting.
dirtyFacet = create_image_from_visibility(vt, npixel=512, cellsize=0.001, npol=1)
future = invert_list_arlexecute_workflow([vt], [dirtyFacet], facets=4, context='facets')
dirtyFacet, sumwt = arlexecute.compute(future, sync=True)[0]

if doplot:
    show_image(dirtyFacet)

print("Max, min in dirty image = %.6f, %.6f, sumwt = %f" % (dirtyFacet.data.max(), dirtyFacet.data.min(), sumwt))
export_image_to_fits(dirtyFacet, '%s/imaging-wterm_dirtyFacet.fits' % (results_dir))
create_image_from_visibility: Parsing parameters to get definition of WCS
create_image_from_visibility: Defining single channel Image at <SkyCoord (ICRS): (ra, dec) in deg
    (15., -45.)>, starting frequency 100000000.0 Hz, and bandwidth 9999999.9999 Hz
create_image_from_visibility: uvmax = 262.634709 wavelengths
create_image_from_visibility: Critical cellsize = 0.001904 radians, 0.109079 degrees
create_image_from_visibility: Cellsize          = 0.001 radians, 0.0572958 degrees
create_image_from_visibility: image shape is [1, 1, 512, 512]
locator: <matplotlib.colorbar._ColorbarAutoLocator object at 0x7f2b901c7b00>
Using auto colorbar locator on colorbar
locator: <matplotlib.colorbar._ColorbarAutoLocator object at 0x7f2b901c7b00>
Setting pcolormesh
Max, min in dirty image = 102.477593, -11.772359, sumwt = 507216.000000
update_title_pos
update_title_pos
update_title_pos
update_title_pos
update_title_pos
update_title_pos
update_title_pos
update_title_pos
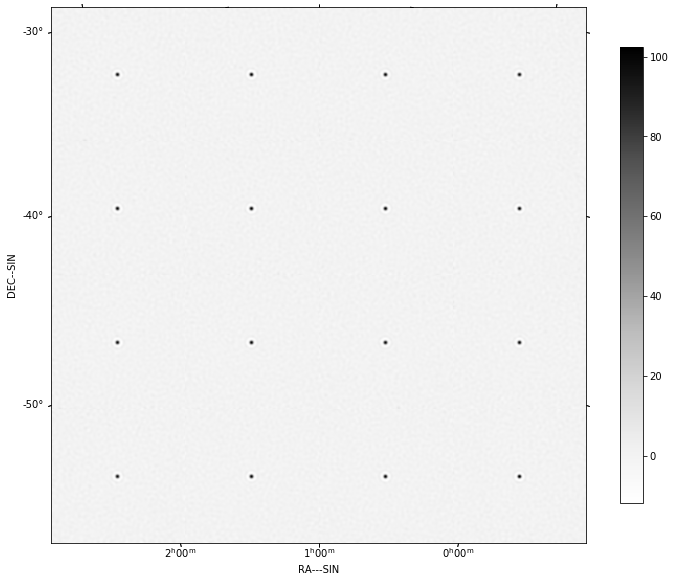
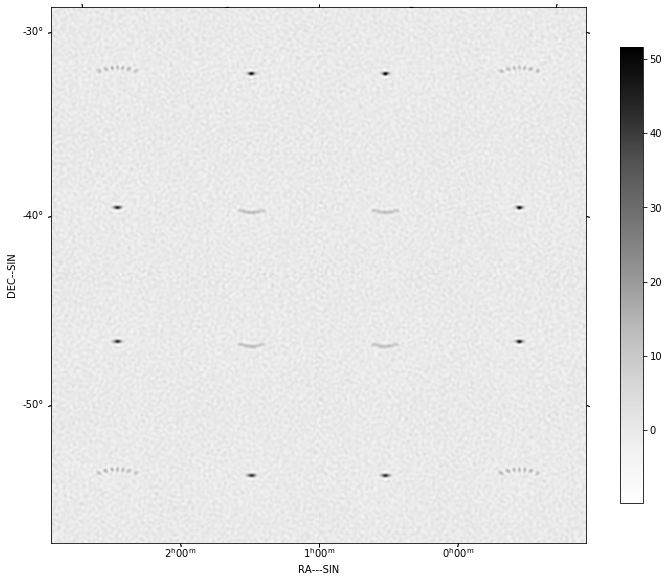
That was the best case. This time, we will not arrange for the partitions to be centred on the sources.
dirtyFacet2 = create_image_from_visibility(vt, npixel=512, cellsize=0.001, npol=1)
future = invert_list_arlexecute_workflow([vt], [dirtyFacet2], facets=2, context='facets')
dirtyFacet2, sumwt = arlexecute.compute(future, sync=True)[0]


if doplot:
    show_image(dirtyFacet2)

print("Max, min in dirty image = %.6f, %.6f, sumwt = %f" % (dirtyFacet2.data.max(), dirtyFacet2.data.min(), sumwt))
export_image_to_fits(dirtyFacet2, '%s/imaging-wterm_dirtyFacet2.fits' % (results_dir))
create_image_from_visibility: Parsing parameters to get definition of WCS
create_image_from_visibility: Defining single channel Image at <SkyCoord (ICRS): (ra, dec) in deg
    (15., -45.)>, starting frequency 100000000.0 Hz, and bandwidth 9999999.9999 Hz
create_image_from_visibility: uvmax = 262.634709 wavelengths
create_image_from_visibility: Critical cellsize = 0.001904 radians, 0.109079 degrees
create_image_from_visibility: Cellsize          = 0.001 radians, 0.0572958 degrees
create_image_from_visibility: image shape is [1, 1, 512, 512]
locator: <matplotlib.colorbar._ColorbarAutoLocator object at 0x7f2b9012e4e0>
Using auto colorbar locator on colorbar
locator: <matplotlib.colorbar._ColorbarAutoLocator object at 0x7f2b9012e4e0>
Setting pcolormesh
Max, min in dirty image = 51.663404, -9.843857, sumwt = 126804.000000
update_title_pos
update_title_pos
update_title_pos
update_title_pos
update_title_pos
update_title_pos
update_title_pos
update_title_pos
Another approach is to partition the visibility data by slices in w. The measurement equation is approximated as:
If images constructed from slices in w are added after applying a w-dependent image plane correction, the w term will be corrected.
The w-dependent w-beam is:
if doplot:
    wterm = create_w_term_like(model, phasecentre=vt.phasecentre, w=numpy.max(vt.w))
    show_image(wterm)
    plt.show()
create_w_term_image: For w = 169.4, field of view = 0.512000, Fresnel number = 11.10
locator: <matplotlib.colorbar._ColorbarAutoLocator object at 0x7f2b90394b38>
Using auto colorbar locator on colorbar
locator: <matplotlib.colorbar._ColorbarAutoLocator object at 0x7f2b90394b38>
Setting pcolormesh
update_title_pos
update_title_pos
update_title_pos
update_title_pos
update_title_pos
update_title_pos

dirtywstack = create_image_from_visibility(vt, npixel=512, cellsize=0.001, npol=1)
future = invert_list_arlexecute_workflow([vt], [dirtywstack], vis_slices=101, context='wstack')
dirtywstack, sumwt = arlexecute.compute(future, sync=True)[0]

show_image(dirtywstack)
plt.show()

print("Max, min in dirty image = %.6f, %.6f, sumwt = %f" %
      (dirtywstack.data.max(), dirtywstack.data.min(), sumwt))

export_image_to_fits(dirtywstack, '%s/imaging-wterm_dirty_wstack.fits' % (results_dir))
create_image_from_visibility: Parsing parameters to get definition of WCS
create_image_from_visibility: Defining single channel Image at <SkyCoord (ICRS): (ra, dec) in deg
    (15., -45.)>, starting frequency 100000000.0 Hz, and bandwidth 9999999.9999 Hz
create_image_from_visibility: uvmax = 262.634709 wavelengths
create_image_from_visibility: Critical cellsize = 0.001904 radians, 0.109079 degrees
create_image_from_visibility: Cellsize          = 0.001 radians, 0.0572958 degrees
create_image_from_visibility: image shape is [1, 1, 512, 512]
locator: <matplotlib.colorbar._ColorbarAutoLocator object at 0x7f2b3ccb4128>
Using auto colorbar locator on colorbar
locator: <matplotlib.colorbar._ColorbarAutoLocator object at 0x7f2b3ccb4128>
Setting pcolormesh
update_title_pos
update_title_pos
update_title_pos
update_title_pos
update_title_pos
update_title_pos
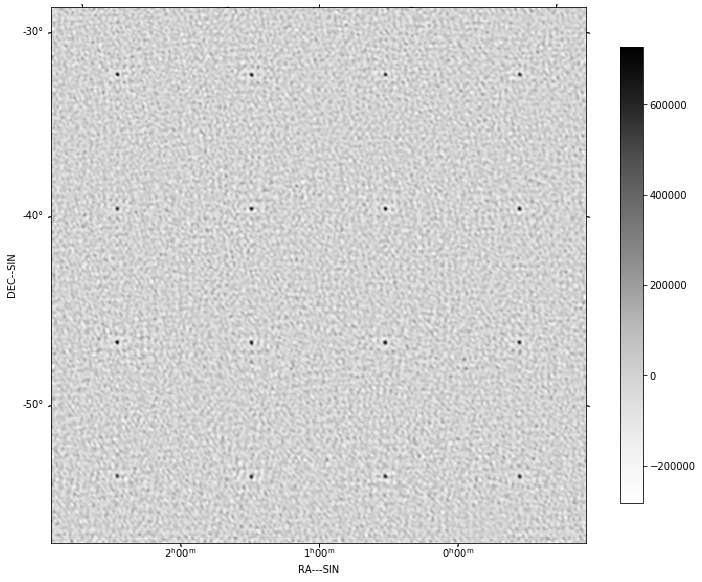
Max, min in dirty image = 728001.342797, -283031.542936, sumwt = 31701.000000
The w-term can also be viewed as a time-variable distortion. Approximating the array as instantaneously co-planar, we have that w can be expressed in terms of \(u,v\)
Transforming to a new coordinate system:
Ignoring changes in the normalisation term, we have:
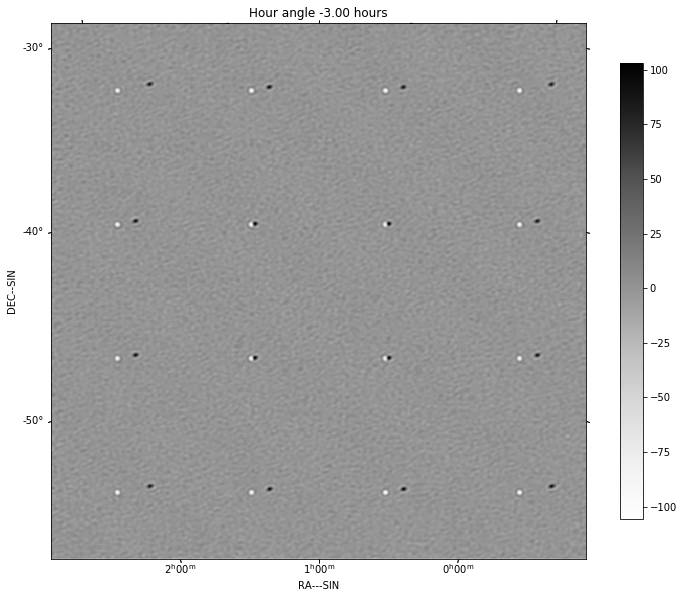
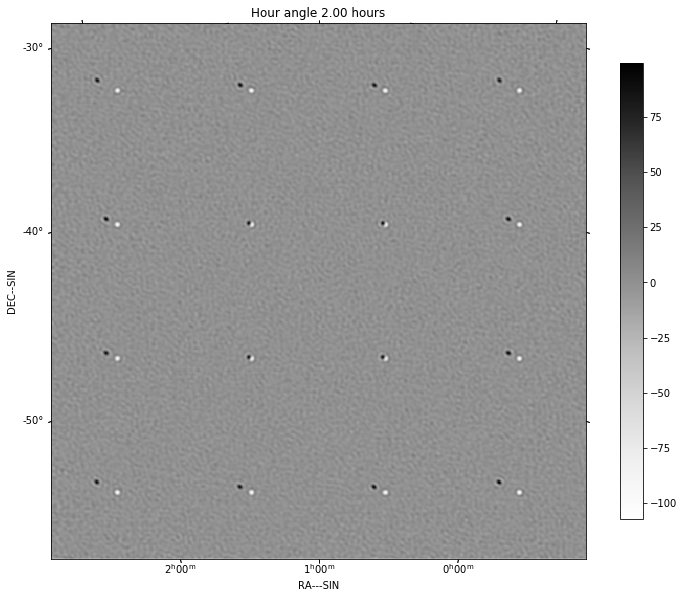
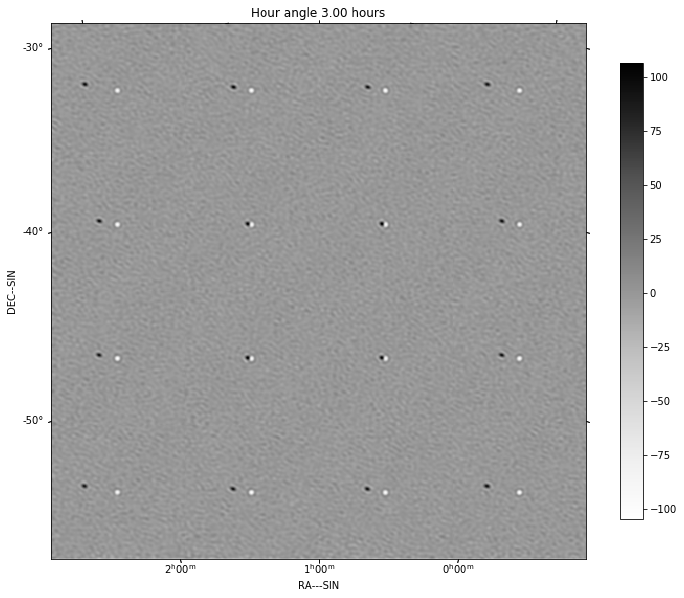
To illustrate this, we will construct images as a function of time. For comparison, we show difference of each time slice from the best facet image. Instantaneously the sources are un-distorted but do lie in the wrong location.
for rows in vis_timeslice_iter(vt):
    visslice = create_visibility_from_rows(vt, rows)
    dirtySnapshot = create_image_from_visibility(visslice, npixel=512, cellsize=0.001, npol=1, compress_factor=0.0)
    future = invert_list_arlexecute_workflow([visslice], [dirtySnapshot], context='2d')
    dirtySnapshot, sumwt = arlexecute.compute(future, sync=True)[0]

    print("Max, min in dirty image = %.6f, %.6f, sumwt = %f" %
          (dirtySnapshot.data.max(), dirtySnapshot.data.min(), sumwt))
    if doplot:
        dirtySnapshot.data -= dirtyFacet.data
        show_image(dirtySnapshot)
        plt.title("Hour angle %.2f hours" % (numpy.average(visslice.time) * 12.0 / 43200.0))
        plt.show()
create_image_from_visibility: Parsing parameters to get definition of WCS
create_image_from_visibility: Defining single channel Image at <SkyCoord (ICRS): (ra, dec) in deg
    (15., -45.)>, starting frequency 100000000.0 Hz, and bandwidth 9999999.9999 Hz
create_image_from_visibility: uvmax = 193.168337 wavelengths
create_image_from_visibility: Critical cellsize = 0.002588 radians, 0.148305 degrees
create_image_from_visibility: Cellsize          = 0.001 radians, 0.0572958 degrees
create_image_from_visibility: image shape is [1, 1, 512, 512]
Max, min in dirty image = 95.641822, -16.727650, sumwt = 4216.610661
locator: <matplotlib.colorbar._ColorbarAutoLocator object at 0x7f2b3cc60320>
Using auto colorbar locator on colorbar
locator: <matplotlib.colorbar._ColorbarAutoLocator object at 0x7f2b3cc60320>
Setting pcolormesh
update_title_pos
findfont: Matching :family=sans-serif:style=normal:variant=normal:weight=normal:stretch=normal:size=12.0 to DejaVu Sans ('/home/jenkins-slave/workspace/ce-library_feature-improved-docs/_build/lib/python3.5/site-packages/matplotlib/mpl-data/fonts/ttf/DejaVuSans.ttf') with score of 0.050000.
update_title_pos
update_title_pos
update_title_pos
update_title_pos
update_title_pos
create_image_from_visibility: Parsing parameters to get definition of WCS
create_image_from_visibility: Defining single channel Image at <SkyCoord (ICRS): (ra, dec) in deg
    (15., -45.)>, starting frequency 100000000.0 Hz, and bandwidth 9999999.9999 Hz
create_image_from_visibility: uvmax = 231.753249 wavelengths
create_image_from_visibility: Critical cellsize = 0.002157 radians, 0.123614 degrees
create_image_from_visibility: Cellsize          = 0.001 radians, 0.0572958 degrees
create_image_from_visibility: image shape is [1, 1, 512, 512]
Max, min in dirty image = 100.519607, -17.807714, sumwt = 4508.422216
locator: <matplotlib.colorbar._ColorbarAutoLocator object at 0x7f2b3cbf9550>
Using auto colorbar locator on colorbar
locator: <matplotlib.colorbar._ColorbarAutoLocator object at 0x7f2b3cbf9550>
Setting pcolormesh
update_title_pos
update_title_pos
update_title_pos
update_title_pos
update_title_pos
update_title_pos

create_image_from_visibility: Parsing parameters to get definition of WCS
create_image_from_visibility: Defining single channel Image at <SkyCoord (ICRS): (ra, dec) in deg
    (15., -45.)>, starting frequency 100000000.0 Hz, and bandwidth 9999999.9999 Hz
create_image_from_visibility: uvmax = 255.914039 wavelengths
create_image_from_visibility: Critical cellsize = 0.001954 radians, 0.111943 degrees
create_image_from_visibility: Cellsize          = 0.001 radians, 0.0572958 degrees
create_image_from_visibility: image shape is [1, 1, 512, 512]
Max, min in dirty image = 99.690697, -17.608646, sumwt = 4735.435580
locator: <matplotlib.colorbar._ColorbarAutoLocator object at 0x7f2b3cb05940>
Using auto colorbar locator on colorbar
locator: <matplotlib.colorbar._ColorbarAutoLocator object at 0x7f2b3cb05940>
Setting pcolormesh
update_title_pos
update_title_pos
update_title_pos
update_title_pos
update_title_pos
update_title_pos

create_image_from_visibility: Parsing parameters to get definition of WCS
create_image_from_visibility: Defining single channel Image at <SkyCoord (ICRS): (ra, dec) in deg
    (15., -45.)>, starting frequency 100000000.0 Hz, and bandwidth 9999999.9999 Hz
create_image_from_visibility: uvmax = 262.634709 wavelengths
create_image_from_visibility: Critical cellsize = 0.001904 radians, 0.109079 degrees
create_image_from_visibility: Cellsize          = 0.001 radians, 0.0572958 degrees
create_image_from_visibility: image shape is [1, 1, 512, 512]
Max, min in dirty image = 102.909868, -19.624505, sumwt = 4806.769444
locator: <matplotlib.colorbar._ColorbarAutoLocator object at 0x7f2b3caa5dd8>
Using auto colorbar locator on colorbar
locator: <matplotlib.colorbar._ColorbarAutoLocator object at 0x7f2b3caa5dd8>
Setting pcolormesh
update_title_pos
update_title_pos
update_title_pos
update_title_pos
update_title_pos
update_title_pos

create_image_from_visibility: Parsing parameters to get definition of WCS
create_image_from_visibility: Defining single channel Image at <SkyCoord (ICRS): (ra, dec) in deg
    (15., -45.)>, starting frequency 100000000.0 Hz, and bandwidth 9999999.9999 Hz
create_image_from_visibility: uvmax = 253.664251 wavelengths
create_image_from_visibility: Critical cellsize = 0.001971 radians, 0.112936 degrees
create_image_from_visibility: Cellsize          = 0.001 radians, 0.0572958 degrees
create_image_from_visibility: image shape is [1, 1, 512, 512]
Max, min in dirty image = 101.931847, -18.677038, sumwt = 4732.772801
locator: <matplotlib.colorbar._ColorbarAutoLocator object at 0x7f2b3cb12748>
Using auto colorbar locator on colorbar
locator: <matplotlib.colorbar._ColorbarAutoLocator object at 0x7f2b3cb12748>
Setting pcolormesh
update_title_pos
update_title_pos
update_title_pos
update_title_pos
update_title_pos
update_title_pos

create_image_from_visibility: Parsing parameters to get definition of WCS
create_image_from_visibility: Defining single channel Image at <SkyCoord (ICRS): (ra, dec) in deg
    (15., -45.)>, starting frequency 100000000.0 Hz, and bandwidth 9999999.9999 Hz
create_image_from_visibility: uvmax = 236.819632 wavelengths
create_image_from_visibility: Critical cellsize = 0.002111 radians, 0.120969 degrees
create_image_from_visibility: Cellsize          = 0.001 radians, 0.0572958 degrees
create_image_from_visibility: image shape is [1, 1, 512, 512]
Max, min in dirty image = 102.692951, -18.823002, sumwt = 4524.935947
locator: <matplotlib.colorbar._ColorbarAutoLocator object at 0x7f2b3ccb4198>
Using auto colorbar locator on colorbar
locator: <matplotlib.colorbar._ColorbarAutoLocator object at 0x7f2b3ccb4198>
Setting pcolormesh
update_title_pos
update_title_pos
update_title_pos
update_title_pos
update_title_pos
update_title_pos
create_image_from_visibility: Parsing parameters to get definition of WCS
create_image_from_visibility: Defining single channel Image at <SkyCoord (ICRS): (ra, dec) in deg
    (15., -45.)>, starting frequency 100000000.0 Hz, and bandwidth 9999999.9999 Hz
create_image_from_visibility: uvmax = 204.762355 wavelengths
create_image_from_visibility: Critical cellsize = 0.002442 radians, 0.139908 degrees
create_image_from_visibility: Cellsize          = 0.001 radians, 0.0572958 degrees
create_image_from_visibility: image shape is [1, 1, 512, 512]
Max, min in dirty image = 98.916621, -17.862308, sumwt = 4176.053350
locator: <matplotlib.colorbar._ColorbarAutoLocator object at 0x7f2b901a3ef0>
Using auto colorbar locator on colorbar
locator: <matplotlib.colorbar._ColorbarAutoLocator object at 0x7f2b901a3ef0>
Setting pcolormesh
update_title_pos
update_title_pos
update_title_pos
update_title_pos
update_title_pos
update_title_pos
This timeslice imaging leads to a straightforward algorithm in which we correct each time slice and then sum the resulting timeslices.
dirtyTimeslice = create_image_from_visibility(vt, npixel=512, cellsize=0.001, npol=1)
future = invert_list_arlexecute_workflow([vt], [dirtyTimeslice], vis_slices=vis_timeslices(vt, 'auto'),
                                       padding=2, context='timeslice')
dirtyTimeslice, sumwt = arlexecute.compute(future, sync=True)[0]


show_image(dirtyTimeslice)
plt.show()

print("Max, min in dirty image = %.6f, %.6f, sumwt = %f" %
      (dirtyTimeslice.data.max(), dirtyTimeslice.data.min(), sumwt))

export_image_to_fits(dirtyTimeslice, '%s/imaging-wterm_dirty_Timeslice.fits' % (results_dir))
create_image_from_visibility: Parsing parameters to get definition of WCS
create_image_from_visibility: Defining single channel Image at <SkyCoord (ICRS): (ra, dec) in deg
    (15., -45.)>, starting frequency 100000000.0 Hz, and bandwidth 9999999.9999 Hz
create_image_from_visibility: uvmax = 262.634709 wavelengths
create_image_from_visibility: Critical cellsize = 0.001904 radians, 0.109079 degrees
create_image_from_visibility: Cellsize          = 0.001 radians, 0.0572958 degrees
create_image_from_visibility: image shape is [1, 1, 512, 512]
locator: <matplotlib.colorbar._ColorbarAutoLocator object at 0x7f2b3ca31668>
Using auto colorbar locator on colorbar
locator: <matplotlib.colorbar._ColorbarAutoLocator object at 0x7f2b3ca31668>
Setting pcolormesh
update_title_pos
update_title_pos
update_title_pos
update_title_pos
update_title_pos
update_title_pos
Max, min in dirty image = 3967923.507510, -689431.950928, sumwt = 31701.000000
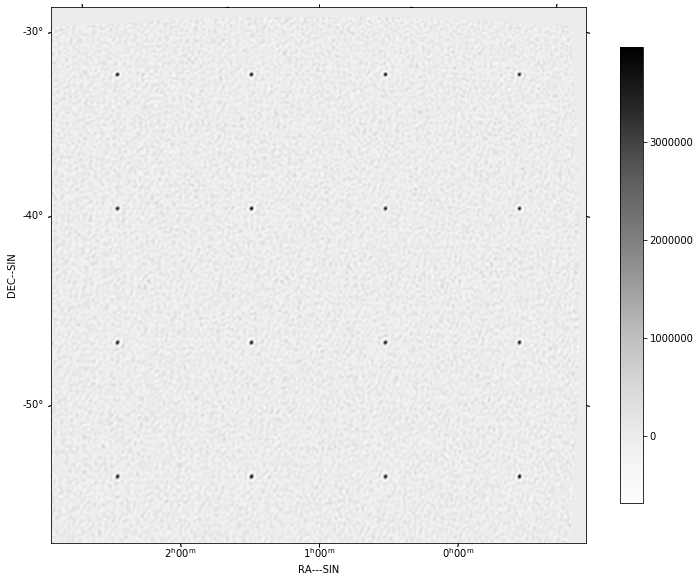
Finally we try w-projection. For a fixed w, the measurement equation can be stated as as a convolution in Fourier space.
where the convolution function is:
Hence when gridding, we can use the transform of the w beam to correct this effect while gridding.
dirtyWProjection = create_image_from_visibility(vt, npixel=512, cellsize=0.001, npol=1)

gcfcf = create_awterm_convolutionfunction(model, nw=101, wstep=800.0/101, oversampling=8,
                                                    support=60,
                                                    use_aaf=True)

future = invert_list_arlexecute_workflow([vt], [dirtyWProjection], context='2d', gcfcf=[gcfcf])

dirtyWProjection, sumwt = arlexecute.compute(future, sync=True)[0]

if doplot:
    show_image(dirtyWProjection)

print("Max, min in dirty image = %.6f, %.6f, sumwt = %f" % (dirtyWProjection.data.max(),
                                                             dirtyWProjection.data.min(), sumwt))
export_image_to_fits(dirtyWProjection, '%s/imaging-wterm_dirty_WProjection.fits' % (results_dir))
create_image_from_visibility: Parsing parameters to get definition of WCS
create_image_from_visibility: Defining single channel Image at <SkyCoord (ICRS): (ra, dec) in deg
    (15., -45.)>, starting frequency 100000000.0 Hz, and bandwidth 9999999.9999 Hz
create_image_from_visibility: uvmax = 262.634709 wavelengths
create_image_from_visibility: Critical cellsize = 0.001904 radians, 0.109079 degrees
create_image_from_visibility: Cellsize          = 0.001 radians, 0.0572958 degrees
create_image_from_visibility: image shape is [1, 1, 512, 512]
create_w_term_image: For w = -396.0, field of view = 0.512000, Fresnel number = 25.95
create_w_term_image: For w = -388.1, field of view = 0.512000, Fresnel number = 25.44
create_w_term_image: For w = -380.2, field of view = 0.512000, Fresnel number = 24.92
create_w_term_image: For w = -372.3, field of view = 0.512000, Fresnel number = 24.40
create_w_term_image: For w = -364.4, field of view = 0.512000, Fresnel number = 23.88
create_w_term_image: For w = -356.4, field of view = 0.512000, Fresnel number = 23.36
create_w_term_image: For w = -348.5, field of view = 0.512000, Fresnel number = 22.84
create_w_term_image: For w = -340.6, field of view = 0.512000, Fresnel number = 22.32
create_w_term_image: For w = -332.7, field of view = 0.512000, Fresnel number = 21.80
create_w_term_image: For w = -324.8, field of view = 0.512000, Fresnel number = 21.28
create_w_term_image: For w = -316.8, field of view = 0.512000, Fresnel number = 20.76
create_w_term_image: For w = -308.9, field of view = 0.512000, Fresnel number = 20.24
create_w_term_image: For w = -301.0, field of view = 0.512000, Fresnel number = 19.73
create_w_term_image: For w = -293.1, field of view = 0.512000, Fresnel number = 19.21
create_w_term_image: For w = -285.1, field of view = 0.512000, Fresnel number = 18.69
create_w_term_image: For w = -277.2, field of view = 0.512000, Fresnel number = 18.17
create_w_term_image: For w = -269.3, field of view = 0.512000, Fresnel number = 17.65
create_w_term_image: For w = -261.4, field of view = 0.512000, Fresnel number = 17.13
create_w_term_image: For w = -253.5, field of view = 0.512000, Fresnel number = 16.61
create_w_term_image: For w = -245.5, field of view = 0.512000, Fresnel number = 16.09
create_w_term_image: For w = -237.6, field of view = 0.512000, Fresnel number = 15.57
create_w_term_image: For w = -229.7, field of view = 0.512000, Fresnel number = 15.05
create_w_term_image: For w = -221.8, field of view = 0.512000, Fresnel number = 14.53
create_w_term_image: For w = -213.9, field of view = 0.512000, Fresnel number = 14.02
create_w_term_image: For w = -205.9, field of view = 0.512000, Fresnel number = 13.50
create_w_term_image: For w = -198.0, field of view = 0.512000, Fresnel number = 12.98
create_w_term_image: For w = -190.1, field of view = 0.512000, Fresnel number = 12.46
create_w_term_image: For w = -182.2, field of view = 0.512000, Fresnel number = 11.94
create_w_term_image: For w = -174.3, field of view = 0.512000, Fresnel number = 11.42
create_w_term_image: For w = -166.3, field of view = 0.512000, Fresnel number = 10.90
create_w_term_image: For w = -158.4, field of view = 0.512000, Fresnel number = 10.38
create_w_term_image: For w = -150.5, field of view = 0.512000, Fresnel number = 9.86
create_w_term_image: For w = -142.6, field of view = 0.512000, Fresnel number = 9.34
create_w_term_image: For w = -134.7, field of view = 0.512000, Fresnel number = 8.82
create_w_term_image: For w = -126.7, field of view = 0.512000, Fresnel number = 8.31
create_w_term_image: For w = -118.8, field of view = 0.512000, Fresnel number = 7.79
create_w_term_image: For w = -110.9, field of view = 0.512000, Fresnel number = 7.27
create_w_term_image: For w = -103.0, field of view = 0.512000, Fresnel number = 6.75
create_w_term_image: For w = -95.0, field of view = 0.512000, Fresnel number = 6.23
create_w_term_image: For w = -87.1, field of view = 0.512000, Fresnel number = 5.71
create_w_term_image: For w = -79.2, field of view = 0.512000, Fresnel number = 5.19
create_w_term_image: For w = -71.3, field of view = 0.512000, Fresnel number = 4.67
create_w_term_image: For w = -63.4, field of view = 0.512000, Fresnel number = 4.15
create_w_term_image: For w = -55.4, field of view = 0.512000, Fresnel number = 3.63
create_w_term_image: For w = -47.5, field of view = 0.512000, Fresnel number = 3.11
create_w_term_image: For w = -39.6, field of view = 0.512000, Fresnel number = 2.60
create_w_term_image: For w = -31.7, field of view = 0.512000, Fresnel number = 2.08
create_w_term_image: For w = -23.8, field of view = 0.512000, Fresnel number = 1.56
create_w_term_image: For w = -15.8, field of view = 0.512000, Fresnel number = 1.04
create_w_term_image: For w = -7.9, field of view = 0.512000, Fresnel number = 0.52
create_w_term_image: For w = 0.0, field of view = 0.512000, Fresnel number = 0.00
create_w_term_image: For w = 7.9, field of view = 0.512000, Fresnel number = 0.52
create_w_term_image: For w = 15.8, field of view = 0.512000, Fresnel number = 1.04
create_w_term_image: For w = 23.8, field of view = 0.512000, Fresnel number = 1.56
create_w_term_image: For w = 31.7, field of view = 0.512000, Fresnel number = 2.08
create_w_term_image: For w = 39.6, field of view = 0.512000, Fresnel number = 2.60
create_w_term_image: For w = 47.5, field of view = 0.512000, Fresnel number = 3.11
create_w_term_image: For w = 55.4, field of view = 0.512000, Fresnel number = 3.63
create_w_term_image: For w = 63.4, field of view = 0.512000, Fresnel number = 4.15
create_w_term_image: For w = 71.3, field of view = 0.512000, Fresnel number = 4.67
create_w_term_image: For w = 79.2, field of view = 0.512000, Fresnel number = 5.19
create_w_term_image: For w = 87.1, field of view = 0.512000, Fresnel number = 5.71
create_w_term_image: For w = 95.0, field of view = 0.512000, Fresnel number = 6.23
create_w_term_image: For w = 103.0, field of view = 0.512000, Fresnel number = 6.75
create_w_term_image: For w = 110.9, field of view = 0.512000, Fresnel number = 7.27
create_w_term_image: For w = 118.8, field of view = 0.512000, Fresnel number = 7.79
create_w_term_image: For w = 126.7, field of view = 0.512000, Fresnel number = 8.31
create_w_term_image: For w = 134.7, field of view = 0.512000, Fresnel number = 8.82
create_w_term_image: For w = 142.6, field of view = 0.512000, Fresnel number = 9.34
create_w_term_image: For w = 150.5, field of view = 0.512000, Fresnel number = 9.86
create_w_term_image: For w = 158.4, field of view = 0.512000, Fresnel number = 10.38
create_w_term_image: For w = 166.3, field of view = 0.512000, Fresnel number = 10.90
create_w_term_image: For w = 174.3, field of view = 0.512000, Fresnel number = 11.42
create_w_term_image: For w = 182.2, field of view = 0.512000, Fresnel number = 11.94
create_w_term_image: For w = 190.1, field of view = 0.512000, Fresnel number = 12.46
create_w_term_image: For w = 198.0, field of view = 0.512000, Fresnel number = 12.98
create_w_term_image: For w = 205.9, field of view = 0.512000, Fresnel number = 13.50
create_w_term_image: For w = 213.9, field of view = 0.512000, Fresnel number = 14.02
create_w_term_image: For w = 221.8, field of view = 0.512000, Fresnel number = 14.53
create_w_term_image: For w = 229.7, field of view = 0.512000, Fresnel number = 15.05
create_w_term_image: For w = 237.6, field of view = 0.512000, Fresnel number = 15.57
create_w_term_image: For w = 245.5, field of view = 0.512000, Fresnel number = 16.09
create_w_term_image: For w = 253.5, field of view = 0.512000, Fresnel number = 16.61
create_w_term_image: For w = 261.4, field of view = 0.512000, Fresnel number = 17.13
create_w_term_image: For w = 269.3, field of view = 0.512000, Fresnel number = 17.65
create_w_term_image: For w = 277.2, field of view = 0.512000, Fresnel number = 18.17
create_w_term_image: For w = 285.1, field of view = 0.512000, Fresnel number = 18.69
create_w_term_image: For w = 293.1, field of view = 0.512000, Fresnel number = 19.21
create_w_term_image: For w = 301.0, field of view = 0.512000, Fresnel number = 19.73
create_w_term_image: For w = 308.9, field of view = 0.512000, Fresnel number = 20.24
create_w_term_image: For w = 316.8, field of view = 0.512000, Fresnel number = 20.76
create_w_term_image: For w = 324.8, field of view = 0.512000, Fresnel number = 21.28
create_w_term_image: For w = 332.7, field of view = 0.512000, Fresnel number = 21.80
create_w_term_image: For w = 340.6, field of view = 0.512000, Fresnel number = 22.32
create_w_term_image: For w = 348.5, field of view = 0.512000, Fresnel number = 22.84
create_w_term_image: For w = 356.4, field of view = 0.512000, Fresnel number = 23.36
create_w_term_image: For w = 364.4, field of view = 0.512000, Fresnel number = 23.88
create_w_term_image: For w = 372.3, field of view = 0.512000, Fresnel number = 24.40
create_w_term_image: For w = 380.2, field of view = 0.512000, Fresnel number = 24.92
create_w_term_image: For w = 388.1, field of view = 0.512000, Fresnel number = 25.44
create_w_term_image: For w = 396.0, field of view = 0.512000, Fresnel number = 25.95
locator: <matplotlib.colorbar._ColorbarAutoLocator object at 0x7f2b3c9e0400>
Using auto colorbar locator on colorbar
locator: <matplotlib.colorbar._ColorbarAutoLocator object at 0x7f2b3c9e0400>
Setting pcolormesh
Max, min in dirty image = 100.225951, -11.016452, sumwt = 31701.000000
update_title_pos
update_title_pos
update_title_pos
update_title_pos
update_title_pos
update_title_pos
update_title_pos
update_title_pos